Market basket analysis in retail

How to understand what your customers really buy
One customer buys diapers and then reaches for beer. Another picks up pasta, tomatoes and basil but forgets the olive oil. Spotting patterns like these is not magic – it is market basket analysis. A tool that is standard in e-commerce and used far too rarely in brick-and-mortar retail.
What is market basket analysis?
Market basket analysis, also known simply as basket analysis, examines which products customers buy together. The goal is to identify patterns that are not visible at first glance.
The principle is simple. Every transaction at the checkout creates a data record: customer X bought products A, B and C at time Y. Multiply that by thousands or millions of transactions, and patterns emerge. Product A is bought together with product B far more often than average. Customers who buy product C rarely reach for product D.
These insights are pure gold for assortment planning, shelf placement, cross-selling campaigns and personalized offers. Amazon built an empire on them. The good news: the same methods also work in brick-and-mortar retail.
Why this topic matters right now
Three developments are making market basket analysis more attractive than ever for brick-and-mortar retail.
Data availability
Modern POS systems have long been capturing all the necessary data. The problem was never collection, but access. Middleware solutions now make this data accessible without replacing the existing IT infrastructure.
Computing power
What used to require expensive specialized software and dedicated servers now runs in the cloud. The cost of data analysis has dropped by orders of magnitude.
Competitive pressure
E-commerce players know their customers better than ever. Brick-and-mortar retailers that fail to catch up lose market share. Market basket analysis is one way to close the knowledge gap.
The key methods at a glance
There are several approaches to analyzing shopping baskets. The three most important for retail are the following.
Association analysis
The classic method. It identifies rules such as: if a customer buys product A, there is an X percent probability that they will also buy product B. The best-known algorithm for this is called Apriori – developed in the 1990s and still the standard today.
Typical applications include cross-selling recommendations, product placement and bundle offers.
Sequence analysis
An extension of association analysis that also takes order into account: not just which products are bought together, but in what sequence they are bought. This is particularly relevant for customer journeys spanning multiple visits.
Typical applications include reactivation campaigns, next-purchase prediction and lifecycle marketing.
Clustering
Here the focus is not on individual product pairs but on customer groups: which customers have similar shopping baskets? The result is segments such as the convenience shopper, the family shopper or the gourmet customer.
Typical applications include target group definition, personalized communication and assortment planning by customer type.
The three metrics you need to know
To understand market basket analysis, you need to know three terms: support, confidence and lift. The math behind them is manageable.
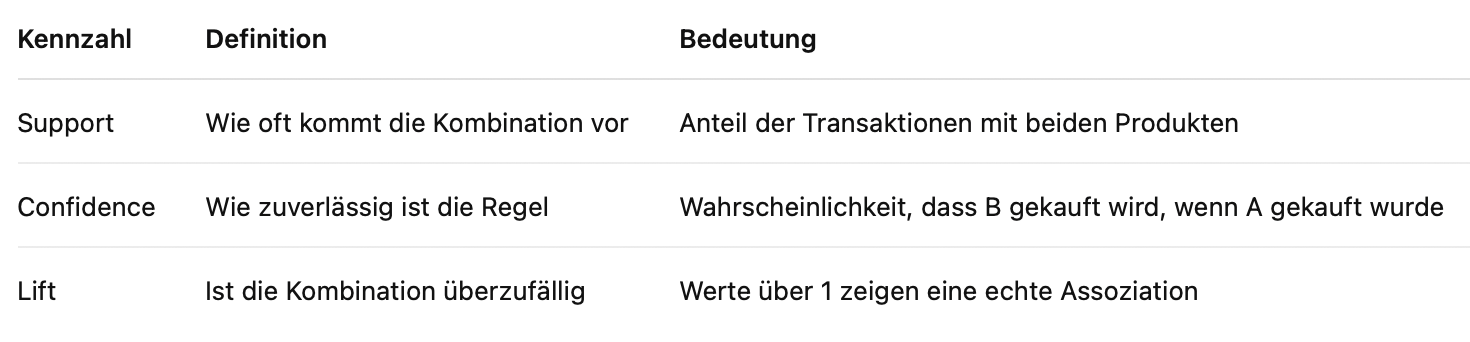
As an illustration, consider a DIY store analyzing paint and brushes. The support for paint and brushes is 8 percent of all transactions. The confidence from paint to brushes is 80 percent. The lift is 4.0, while brushes alone have a support of 20 percent.
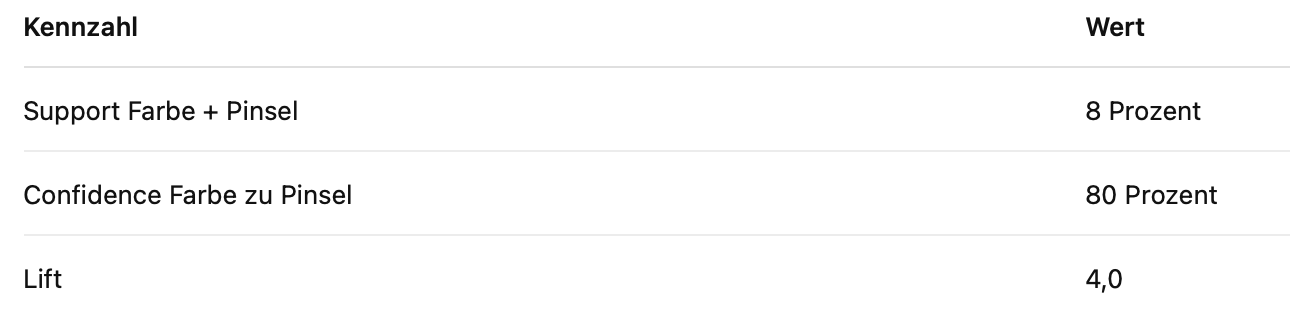
The interpretation reads as follows: paint and brushes are bought together in 8 percent of all transactions. Of all customers who buy paint, 80 percent also reach for a brush. The lift of 4.0 shows that this combination occurs four times more often than random distribution would suggest. This is a strong association.
Real-world examples from different sectors
Market basket analysis works across sectors. In grocery retail, it turns out that customers who buy organic milk are far more likely than average to also pick up organic eggs and whole-grain bread. Retailers respond by setting up an organic corner in the store that brings all three product groups together. The result is a 15 percent higher average receipt value among organic shoppers.
In fashion retail, customers who buy jeans also buy a belt in 35 percent of cases – but only if both products are available on the same day. A belt display right next to the jeans section and well-trained sales staff lead to a 40 percent increase in belt sales.
In DIY stores, customers who buy laminate flooring often forget the underlay. They come back later or buy it elsewhere. An automatic reminder on the digital receipt with a direct link to the online shop leads 25 percent of customers to buy the forgotten product after all.
In drugstores, buyers of hair dye rarely purchase hair treatments at the same time, even though experts would recommend exactly that combination. A bundle offer with a small price advantage and staff training on how to advise customers double the cross-selling rate in this category.
Five mistakes to avoid
Do not over-interpret trivial correlations. The fact that burger buns and ground beef are bought together is not a real insight. Data sets that are too small lead to distorted results, as seasonal effects and promotions skew the picture.
Do not ignore the lift. High confidence alone means little if a product is frequently bought anyway. Likewise, do not confuse correlation with causation: patterns are starting points for hypotheses, not certainties.
Finally, always test your findings. Market basket analysis delivers ideas, not guarantees. Measures should first be tested in individual stores. A/B testing is possible in brick-and-mortar retail, too.
How to get started: a step-by-step guide
You do not need to be a data scientist to benefit from market basket analysis. Getting started begins with clarifying how to access your transaction data. For each transaction, you need a unique transaction ID, the date and time, and all purchased items with their item numbers. Customer data is not strictly necessary at the start.
The next step is cleaning the data. Returns, cancellations and obvious outliers are removed. For very large assortments, aggregating at the product group level is recommended.
For the analysis itself, Excel with pivot tables is enough to get started. Specialized tools are available for deeper analyses. A minimum support of 1 percent and a minimum confidence of 50 percent are sensible starting points.
Sort the results by lift and filter out trivial combinations. Focus on the top 10 to 20 non-obvious associations.
For each relevant association, define concrete measures – such as a different shelf placement, bundle offers, staff training or digital recommendations. These measures should have measurable goals and be tested first.
Which tools do you need?
The choice of tool depends on your resources and ambitions. Excel is free and familiar, but it is only suitable for limited data volumes and requires manual effort. BI tools offer visualization and dashboards, but they take time to learn and are often not retail-specific.
Retail analytics solutions are industry-specific, preconfigured and often integrated with POS systems, but they come with ongoing costs and a degree of vendor dependency. Custom code offers maximum flexibility and scalability, but it requires developers and a high initial effort.
For most mid-market retailers, a specialized retail analytics solution is the best compromise between a low barrier to entry and meaningful results.
Conclusion: the shopping basket as a treasure chest
Every transaction that runs through your checkouts contains valuable information. Market basket analysis puts it to work – not as an abstract analytics project, but as a practical tool for better assortments, smarter placements and more relevant offers.
Getting started does not have to be complicated. Begin with your top-selling products. Identify three to five non-obvious correlations. Test one measure and build from there.
You already have the data. The methods are proven. All that is missing is the first step.
About Purchase Intelligence
anybill Purchase Intelligence makes market basket analysis accessible to mid-market companies. The platform connects to your POS system, analyzes transaction data automatically and delivers product affinities you can act on directly. No data science team, no months of implementation.
Discover it now. Request a demo at anybill.de/de/product/features/purchase-intelligence and see the potential hidden in your data.
Weitere Blogbeiträge