The question is justified: Is an analytics solution really worthwhile? This article calculates which levers retail analytics uses, which results are realistic and when the investment pays off.
As a managing director or commercial manager, you know that: Every provider promises ROI. But it rarely becomes concrete what is behind it. This article provides figures, not advertising promises. The assumptions are chosen conservatively. Your results may be better.
The typical investment
How much does a retail analytics solution cost? The range is wide. For a medium-sized retailer with 10 to 50 branches, the following scales are realistic:
Setup and integration
10,000 to 30,000 euros one-time
Monthly license
1,500 to 5,000 euros, depending on branches and turnover
Internal expenditure
0.5 to 1 FTE pro rata for analysis and implementation
Calculation example:
A retailer with 25 branches and an annual turnover of 40 million euros expects monthly costs of around 2,500 euros, i.e. 30,000 euros per year. There is also a one-time fee of 15,000 euros for setup and integration. In the first year, the total investment is 45,000 euros.
Five levers for ROI
Retail analytics does not work through a single effect, but through several levers at the same time. The most important five:
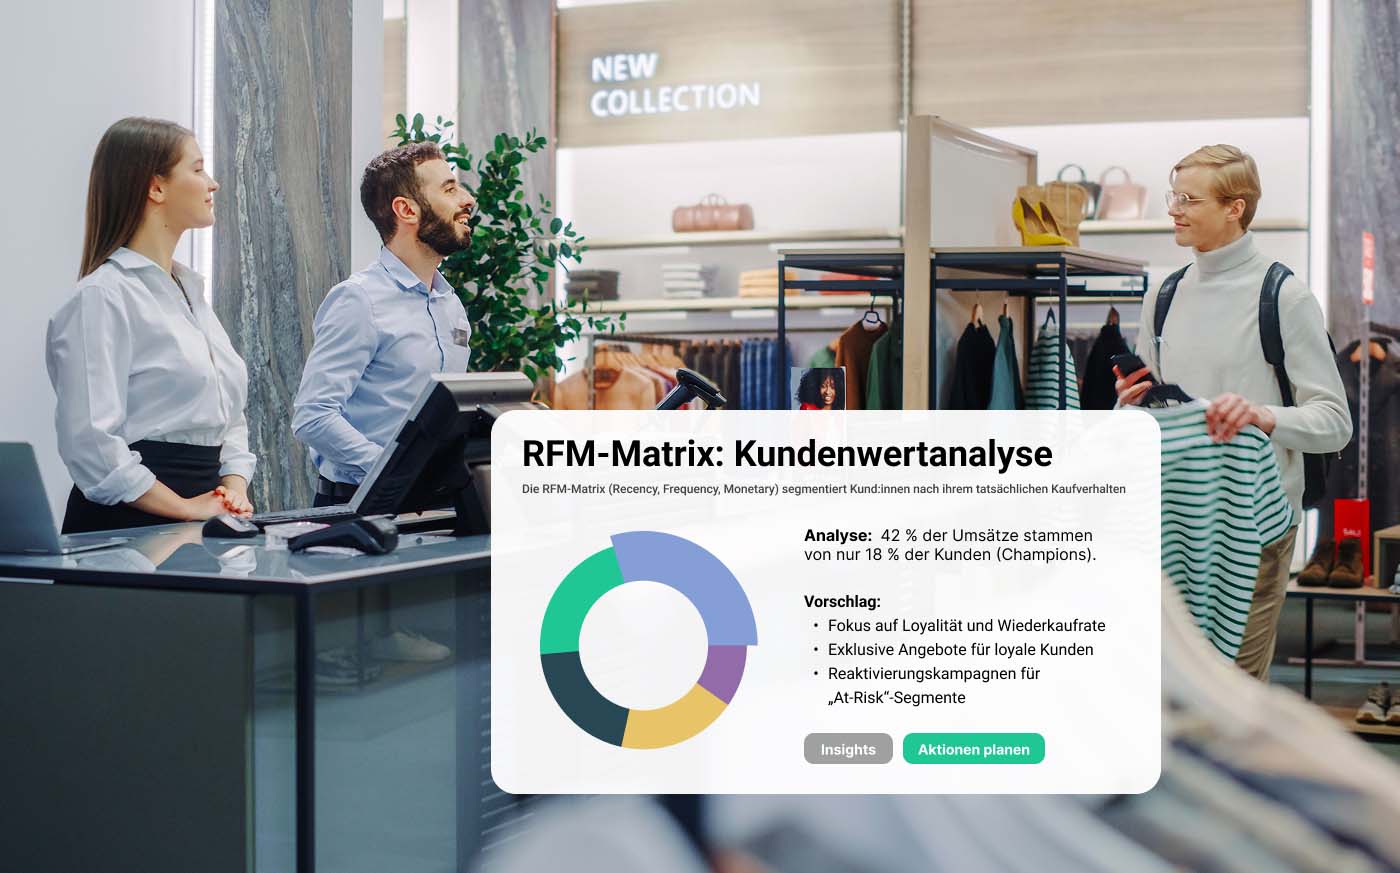
01 Cross-selling through shopping cart analysis
The shopping cart analysis shows which products are bought together and which are not. Products that logically belong together but rarely end up in the same shopping cart are missed opportunities.
These opportunities can be increased through better placement, targeted recommendations or bundles.
Conservative assumption: 0.5 percent increase in sales due to identified cross-selling potential
With a turnover of 40 million euros:
40,000,000 x 0.5 percent = 200,000 euros additional turnover
Earnings contribution with a 30 percent margin:
60,000 euros
02 Shrinkage reduction through pattern recognition
Shrinkage, whether due to theft, spoilage or process errors, eats away at margins. Analytics solutions identify anomalies in transaction data: unusually high cancellation rates, unusual cashier patterns, or products with above-average shrinkage.
Conservative assumption: 10 percent reduction in shrinkage
With a turnover of 40 million euros and a loss of 2 percent:
800,000 x 10 percent = 80,000 euros less loss
Direct improvement of results:
80,000 euros
03 Product range optimization through sales analysis
Which articles perform, which don't? Which products take up shelf space without reasonable turnover?
Conservative assumption: 0.3 percent increase in turnover due to optimised space
With a turnover of 40 million euros:
40,000,000 x 0.3 percent = 120,000 euros additional turnover
Earnings contribution with a 30 percent margin:
36,000 euros
04 Saving time through automated reports
How much time does your team spend on reports, data exports, and preparation?
Conservative assumption:
2 hours of time saved per week for 3 employees
Annual savings:
6 hours x 52 weeks = 312 hours
With an hourly cost rate of 50 euros:
312 x 50 = 15,600 euros
Cost savings:
15,600 euros
05 New revenue from retail media
Retail media is opening up new sources of revenue via existing touchpoints.
Conservative assumption:
5,000 euros per month in the first year
With an 80 percent margin:
60,000 x 80 percent = 48,000 euros profit contribution
New revenue source:
48,000 euros
The bill summarized
Cross-selling: 60,000 euros
Shrinkage reduction: 80,000 euros
Product range optimization: 36,000 euros
Time saved: 15,600 euros
Retail media: 48,000 euros
Total profit contribution: 239,600 euros
Investment year 1:45,000 euros
ROI year 1:432 percent
Payback period
With an investment of 45,000 euros and an annual profit contribution of 239,600 euros, the investment pays off in less than three months.
45,000/239,600 = 0.19 years = approx. 2.3 months
Even with halved assumptions, the payback is less than six months.
When is the investment worthwhile?
High ROI likely
✓ Turnover over 20 million euros
✓ More than 10 branches
✓ Customer card or digital touchpoint
✓ High product range complexity
✓ Known shrinkage problem
Lower ROI likely
✗ Turnover below 5 million euros
✗ Single site
✗ Already highly optimized product range
✗ Very narrow range
✗ No implementation capacity
Rule of thumb:
Starting at 10 million euros in annual turnover and at least 5 branches, the investment usually makes sense.
Checklist: Is retail analytics right for you?
☐ No systematic overview of product affinities
☐ A lot of time spent on manual reports
☐ Product range decisions are based on feeling
☐ Shrinkage cannot be fully explained
☐ Retail media potential unused
3 or more yes answers: A conversation is worthwhile.
conclusion
The question is not whether retail analytics pays off. The question is how quickly.
With conservative assumptions, the investment pays off in just a few months. The annual profit contribution significantly exceeds the costs.
The real question is: What does it cost not to invest?
About Purchase Intelligence
anybills Purchase Intelligence addresses all five levers of this business case. The platform connects to your cash register system, provides shopping cart analyses, identifies anomalies and unlocks retail media potential.